
The ongoing industrial action by combined Teachers’ groups is just the latest example of “industrial friction” seeking resolution of long-standing grievances. Almost without exception these actions are characterised by two common factors: they are confined to large, well-organised groups of specialised staff (think Teachers, Doctors, Nurses, Ambulance Officers for example), and they typically involve groups employed in the Not for Profit (NfP) sector, where funding comes largely from Central or Local Government.
I am not going to debate the individual merits of each here. However I have noted that these claims also divert attention from another long-standing question: do pay rates across the Not for Profit sector continue to lag those in other sectors?
Apparently lost in the current debate is the fact that the sector does not just employ people in high profile specialist roles. Government agencies (including Health and Education agencies) and Local Authorities are among the largest employers in many regions, employing significant numbers of staff in roles which are also common in other industries: Administration, IT, Human Resources and Finance for example. How do their pay rates stack up against the general market, given that these agencies also need to recruit these staff from the same general market as other employers?
To provide some focus on this we have undertaken additional analysis of our March 2019 pay survey results. That survey included over 35 000 individual records, across 297 different positions, sourced from 474 employers. Of those 474 Employers, a significant proportion (around 40 percent) were from the NfP sector (primarily Central and Local Government, Health, Education and Social Services), providing a substantial sample of 15 000 records for further analysis.
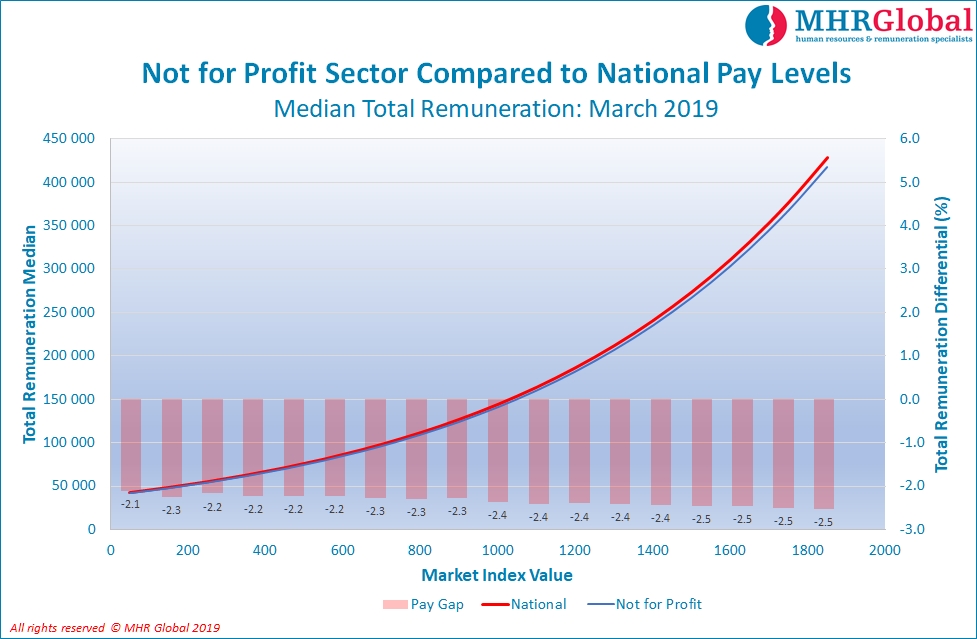
The accompanying chart (click on the chart to expand) shows Median Total Remuneration rates plotted against our job evaluation values at 100 point intervals (job evaluation provides a measure of relative value of different jobs, providing a consistent foundation for this comparison). The bars plotted against the secondary axis (on the right) show the margin between NfP rates and national rates at these intervals. The fact that all these bars are red, and drop below the “zero” baseline confirms that NfP Total Remuneration rates do lag national rates – but not by much, reducing from just minus-2.1 percent for entry level roles to minus-2.5 percent at the Top Executive levels.
To provide context, the roles up to the 400 point value represent entry level roles (school leavers and new graduates); Top Executive roles start around the 1200 point mark.
Looking at this in isolation it would be easy to conclude that pay rates in the NfP sector are consistently low, although by less than 3.0 percent on average, so is this really a problem? We need to look more deeply.
When Base Salary rates are considered, while there is still a gap for entry level roles (about 1.6 percent), beyond that level Median Base Salary figures are actually higher in the NfP sector than they are nationally, with NfP roles enjoying an advantage of nearly 5.0 percent at the top end when Base Salary only is considered.

This is clearly illustrated in the second chart by both the positioning of the blue “NfP” curve above the red national curve, and by the blue bars showing the positive differential in Base Salary Median rates above the entry level range (400 points).
So why does this picture change so dramatically? If Base Salary levels (at least, those beyond entry level roles) are actually higher than those in the wider market, why are Total Remuneration figures lower across the board?
To answer those questions we look deeper again, to focus on different practices in relation to the provision of benefits, which make up the difference between Base Salary and Total Remuneration. We need to focus on the provision of the “big ticket” items of Bonus and incentive payments, and the provision of Motor Vehicles.
The table below provides a comparison of selected key benefits across the NfP sector and the national figures, providing both availability rates and average values.

This clearly shows that for the most significant benefits (Bonus payments and Motor Vehicles) there are substantial differences either in the percentage of employees receiving the benefit, or in the average value of that benefit – or both. Those advantages enjoyed in the wider market are also pitched at a substantially higher value Top Executive level.
In contrast, both the availability and the average value of KiwiSaver/ Superannuation Employer contributions differ little between the NfP sector and nationally – which is not altogether surprising, given the legislative framework in this area.
So what does this mean for employers in the Not for Profit sector?
Clearly remuneration practices within the NfP sector have developed in a very different direction to those used in the commercial sectors.
The most obvious difference is seen in an apparent reluctance to provide employees with benefits which could be perceived by the public as being unjustified “perks”: for example, Motor Vehicles and Bonus/Incentive payments.
Ironically that reluctance has resulted in employers offering higher Base Salary payments in order to compete for and retain staff, thereby increasing the cost of core remuneration. So to that extent the practice appears counter-productive.
I would also expect these higher Base Salaries to be seen at the entry level in future, as increasing numbers of NfP employers – particularly in the Local Government area – adopt “Living Wage” programmes.
The details will vary, depending on the specific roles being consoidered. A prudent employer in the Not for Profit Sector will consider these differences when making decisions on starting rates for new appointees and during annual review processes, in order to make better informed decsions.
