
There is a long-held perception in New Zealand that pay rates within the Not for Profit (NfP) sector are not as generous as those available in other sectors. Pay increases are also thought to be less competitive. It is generally thought that this “practice” flows from a preference by organisations within the sector to direct funding towards the delivery of services rather than to the recruitment and retention of staff on competitive pay. This article drills into the results from MHR’s March 2024 pay survey to establish whether there is any truth in these perceptions.
Average Increases in Base Salary
One way of comparing the relative generosity of pay practices between sectors is to look at the level of pay increases which have been awarded in the last 12 months. As the accompanying chart shows, the perception that other sectors pay better than the NFP sector appears to hold true for the Top Executives, with increases across the wider market being slightly higher than those offered within the NfP sector. In the case of General Staff however, increases in the past 12 months have been marginally higher within the NFP sector than across other sectors.

At first viewing that latter result is perhaps surprising, however to provide some context it needs to be recognised that in recent years there have been a number of relatively generous settlements of long-standing pay claims covering large groups of employees within the public sectors in particular. Given that many of these roles (such as nurses) are also employed within the wider NfP sector it should not be surprising that these settlements have also influenced increases for other staff within this sector.
The second chart shows the distribution of increases across all General Staff and compares this to the results for the NfP sector. The different distribution of increases brings some understanding of the higher average previously identified for the NfP sector.
Key factors which influence this are:
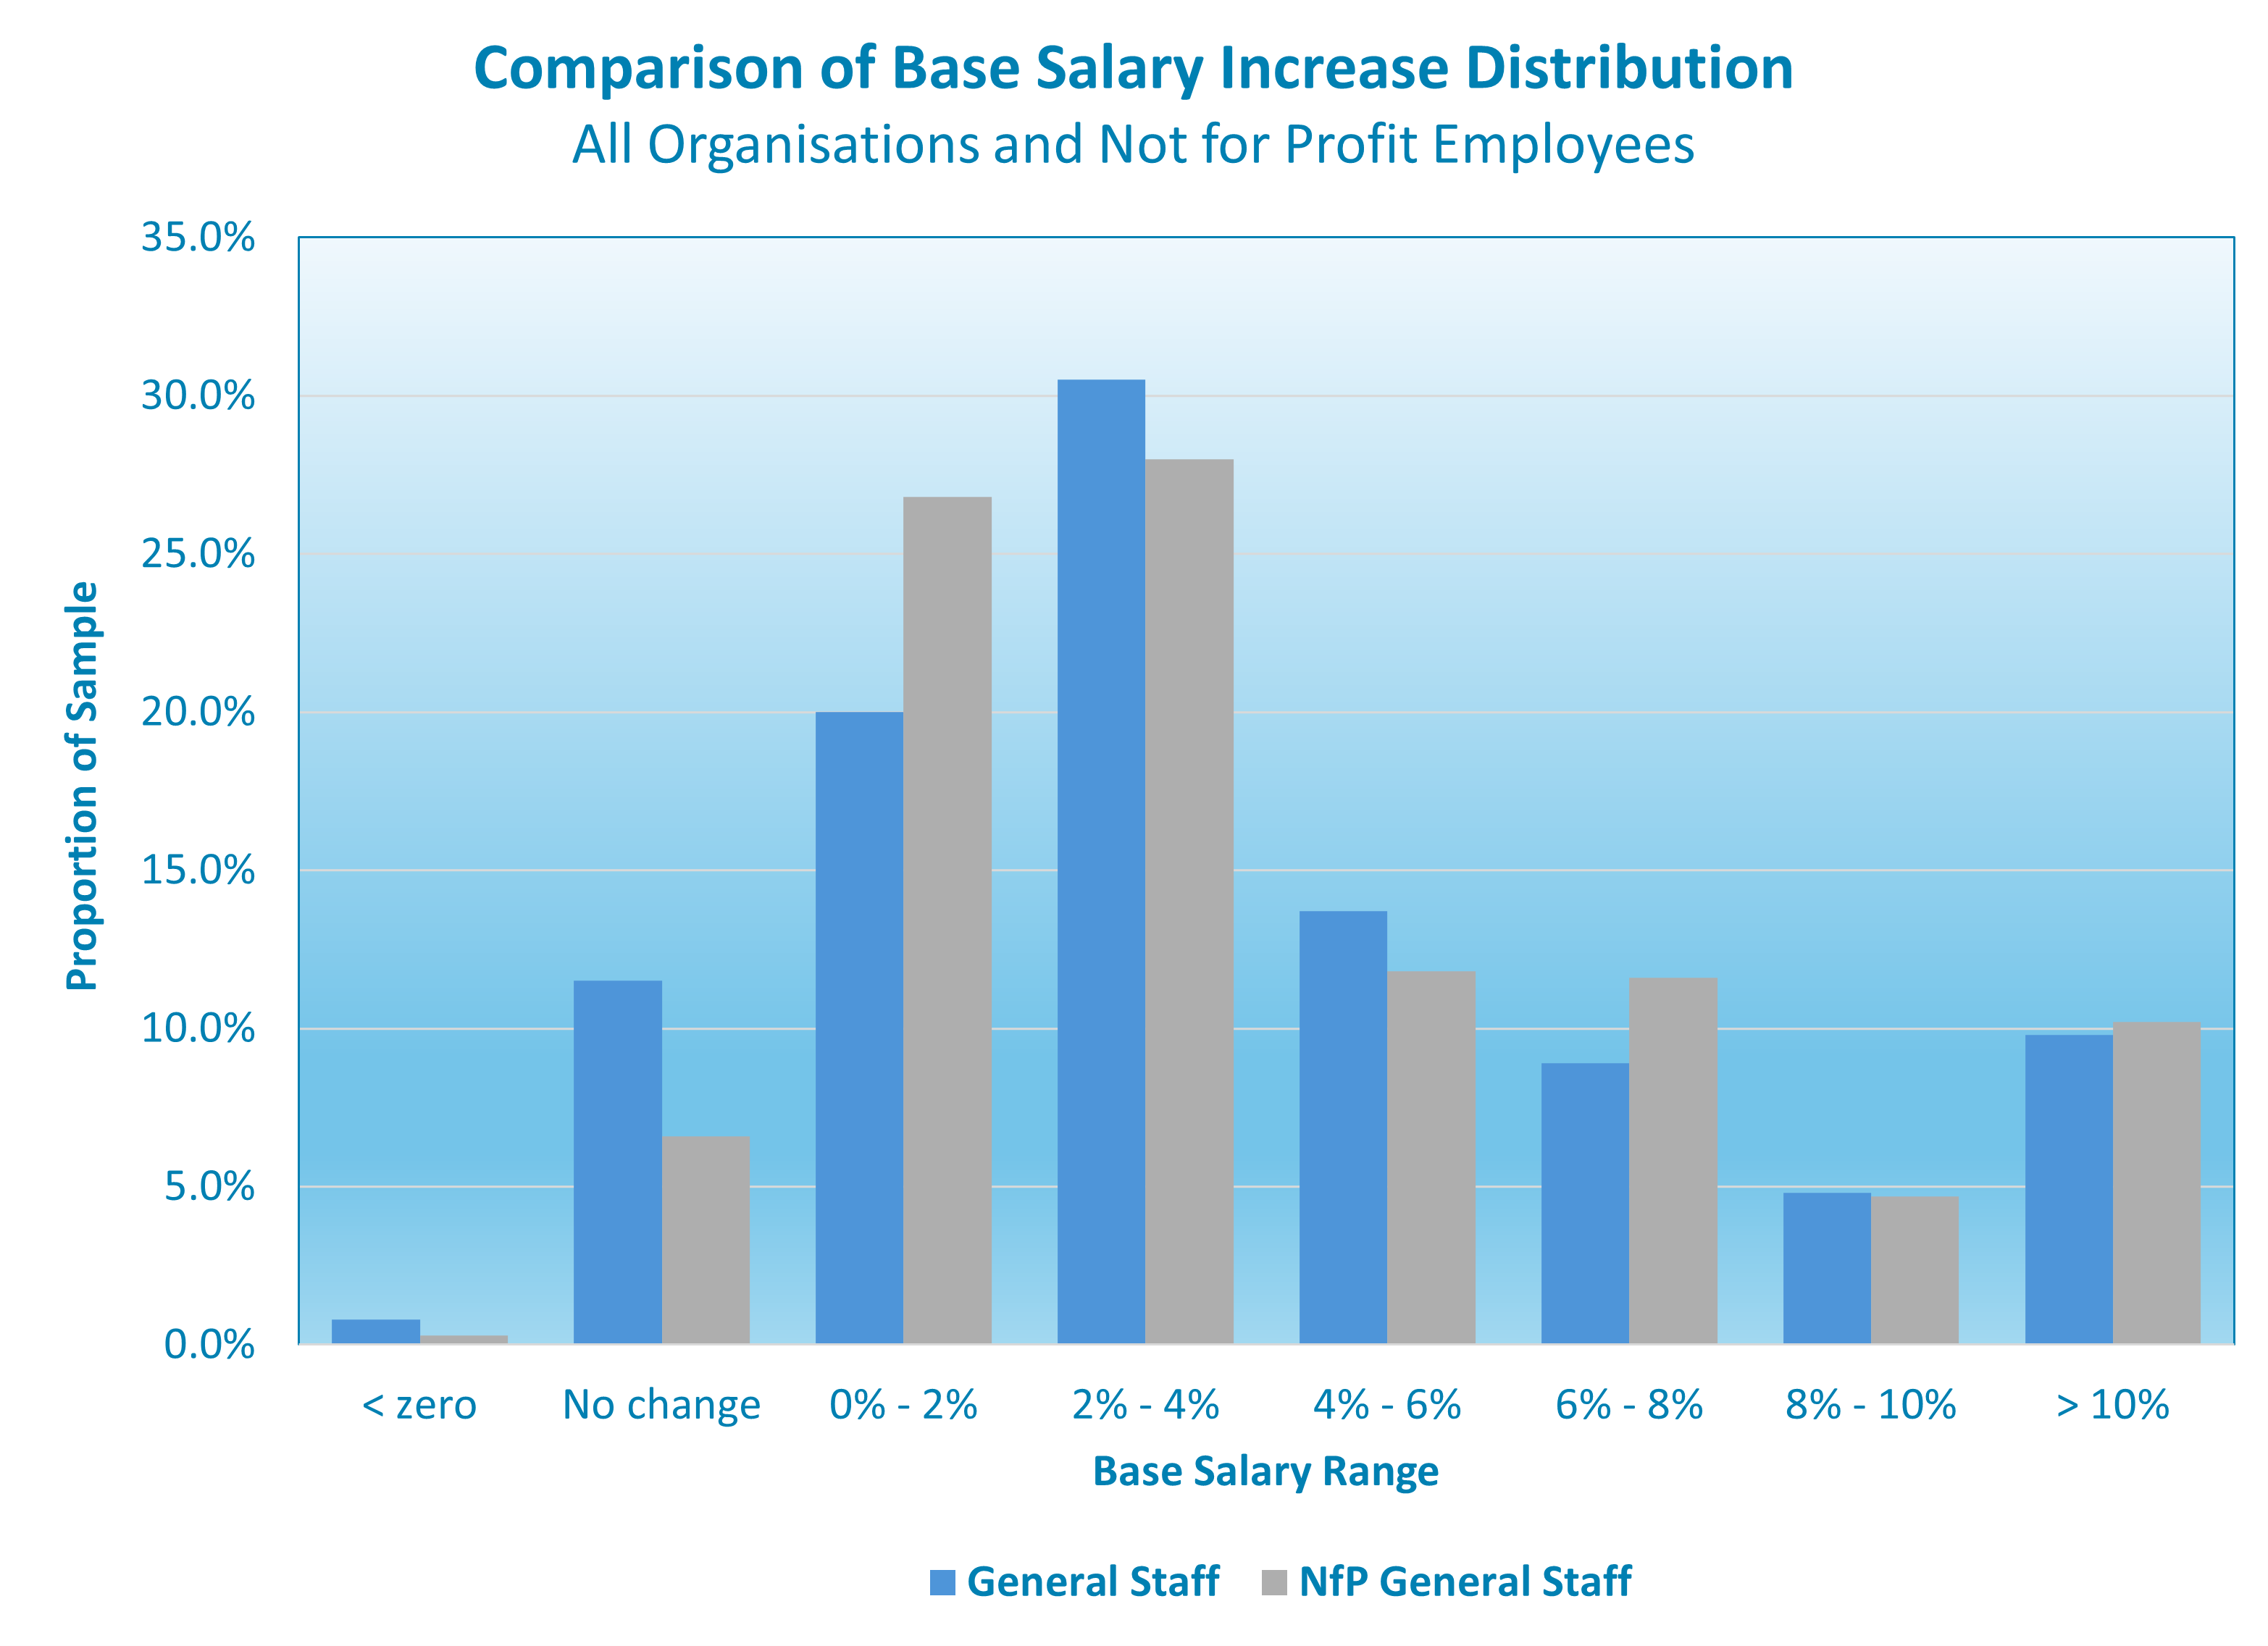
- The higher proportion of General Staff nationally who received no increase
- The larger proportion of NfP staff receiving increases in the 6.0 to 8.0 percent range:
- These are likely result from a combination of higher levels of adjustment to underlying pay rates, along with movement up a pay range.
Distribution of Total Remuneration
Comparing the distribution of Total Remuneration for General Staff is also enlightening. As the chart shows the distribution pattern within the NfP sector differs from the general market in several significant areas:
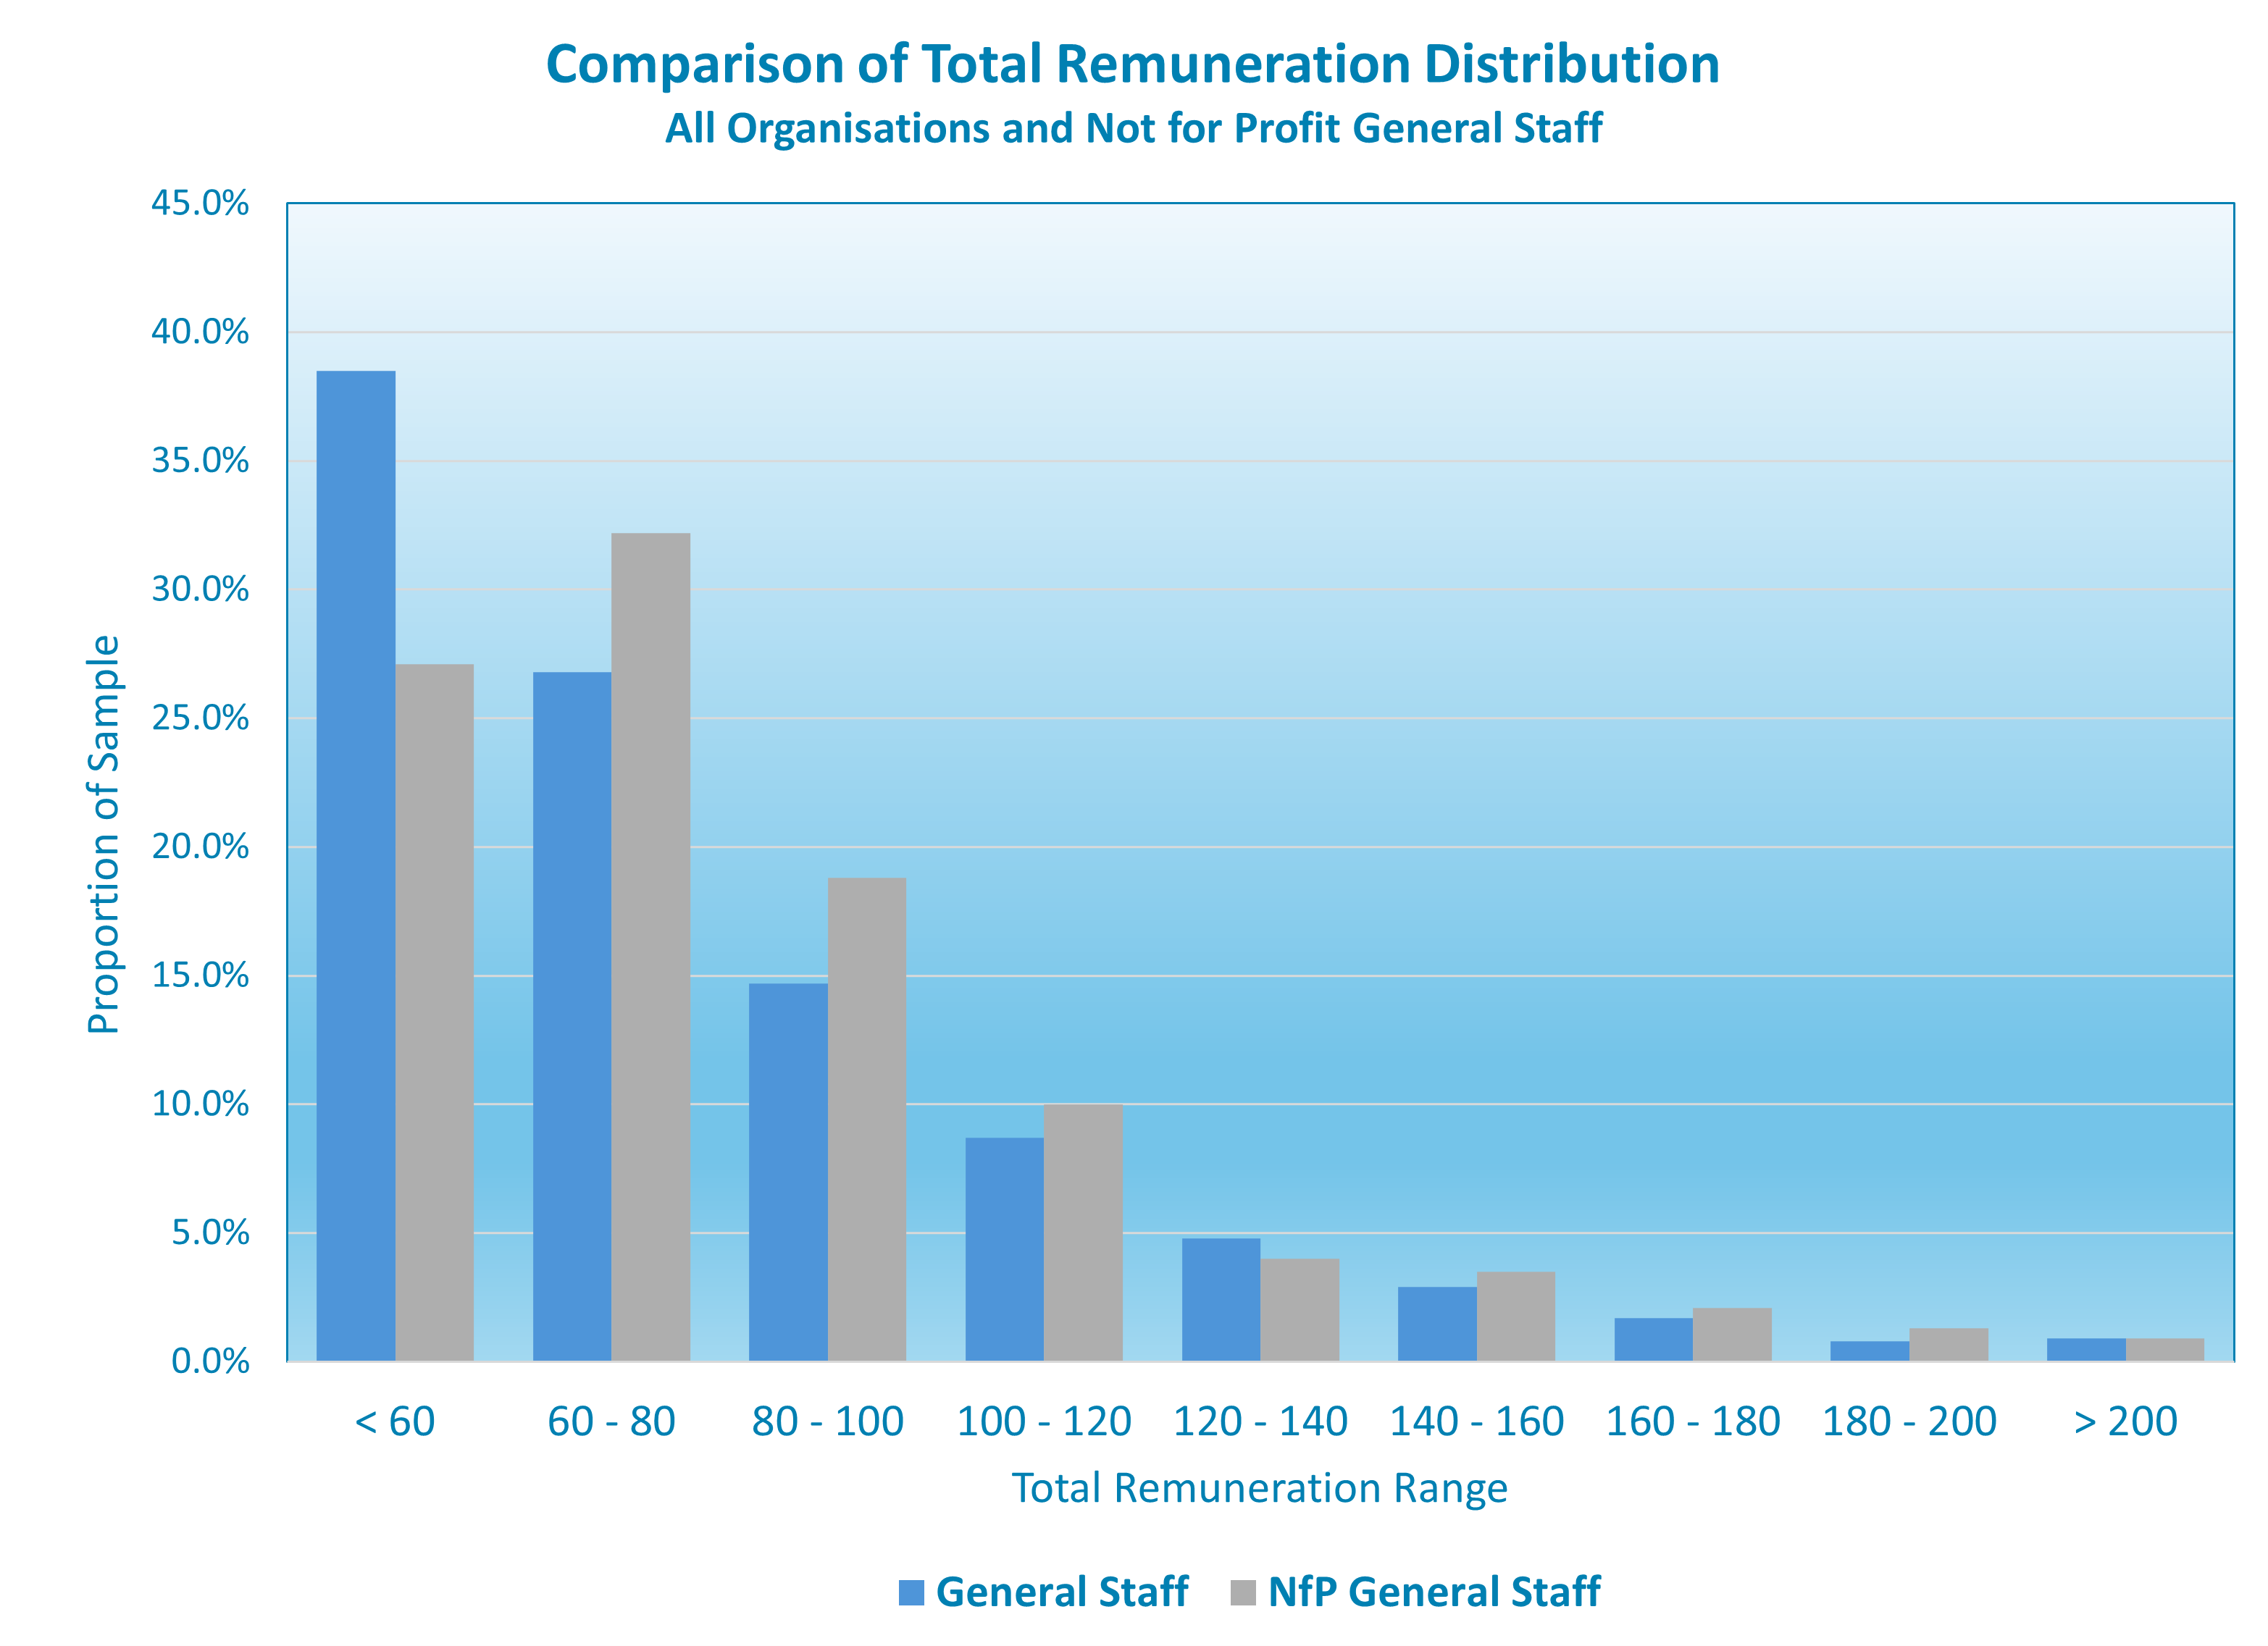
- A significantly higher proportion of staff in the general market receive Total Remuneration of less than $60 000 annually (38.5 percent compared to 27.1 percent in the NfP sector):
- This is a result of a higher number of staff in basic rate roles in Manufacturing, Retail and Service industries:
- Many of these roles are simply not as prevalent in the NfP sector.
- This is a result of a higher number of staff in basic rate roles in Manufacturing, Retail and Service industries:
- A higher proportion of staff paid in the $60 000 to $120 00 range in the NfP sector (61 percent) than in the general market (50 percent)
- Roles in this range are typically for experienced staff, perhaps with some supervisory or lower management responsibilities;
- In smaller NfP organisations this range would also include “sole charge” specialists, which are relatively common in small organisations.
Although there are clear differences in distribution, Median Total Remuneration for General Staff in the overall market remains marginally higher than the Median for the NfP sector. Notably however, the difference between the two figures is relatively small, which suggests relativity may change from year to year.
More significantly, these figures show that the long-held perception that NfP employers are “less generous” than employers in other sectors has little real substance, with many NfP employers demonstrating a willingness to meet the market for the right person.
